
The reporting page is very much like the dashboard overview, but with some key differences. It lets you refine the results by date, and individual campaign, and export results as a PDF.
Lets look at the page and what each metric means for your marketing progress:
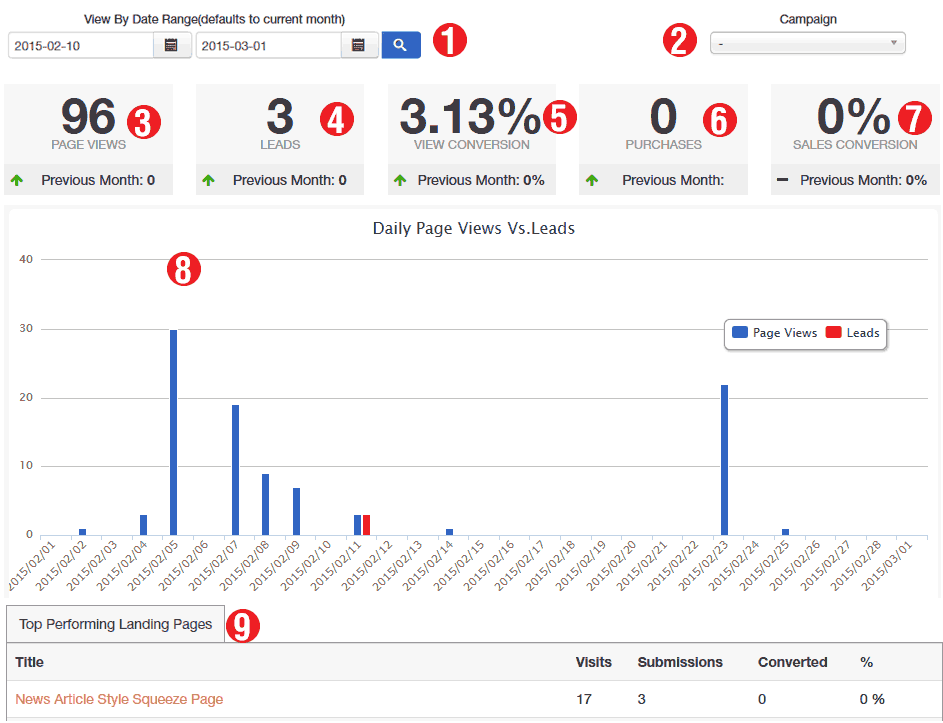
- View by Date Range: This will filter reporting data for just the date range specified. The chart can only show so much data at this stage, in full release data will scale depending on the time frame selected, for now, if you get a blank graphic, select a shorter time frame of data (usually 1 month).
- Campaign Filter: This will show reporting data for just the selected campaign, or for all campaigns if no single campaign is selected.
- Page Views: This statistic shows you a total of how many page views you have over all campaigns for the month (Start to end of month). It also shows you this figure in comparison to last month's results, a red arrow indicates you're below last month's results, a green UP arrow indicates you're doing better when compared to the previous month's results.
- Leads: This represents how many new leads your campaigns have generated this month. It contains the same Start to End of month Timeframe, and previous month comparisons as Page Views.
- View Conversion: This is the how high you are converting Page Views into new leads. It contains the same Start to End of month Timeframe, and previous month comparisons as Page Views.
- Purchases: This represents how many new purchases your campaigns have generated this month. It contains the same Start to End of month Timeframe, and previous month comparisons as Page Views.
- Sales Conversion: This represents the percentage conversion rate of many people purchased your product, as compared to how many have SEEN your sales pages. It contains the same Start to End of month Timeframe, and previous month comparisons as Page Views.
- Reporting Chart: This graph shows you a day by day representation of how many Page Views you have had per day, compared to how many Leads you have generated for the day over all campaigns, you can hover over the bar graphs to get the exact figures for that item.
- Top Performing Landing Pages: This shows you an overview of your Top Performing landing Pages in the system, along with visits, form submissions and how many converted (that is how many hit a set 'conversion' status), along with the percentage representation of that conversion rate.